 Map with ranges of values: representation of an indicator with relative values
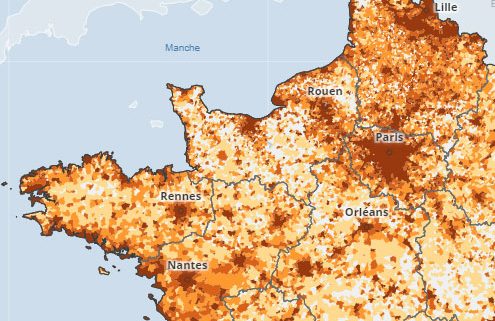
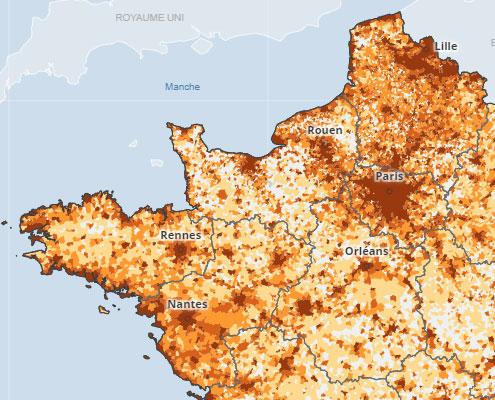
This kind of map represents the distribution of geographical objects according to the value ranges of a relative quantitative indicator. Each geographical object is colored with a given color according to the value of the indicator, so it is a choropleth map. This representation mode is suitable for indicators such as rates, percentages, densities.
The map produced will depend on the choice of the discretization method, i.e. how to determine the thresholds of the value ranges. Géoclip offers several methods, in the settings panel accessible from the map key. In this panel, it is also possible to choose between different color palettes.
The illustration shows the proportion of artificial territories by municipality. The darkest colours correspond to the slices with the highest artificialisation rate. A tip: to isolate one of the slices, simply click on the square of its color in the legend to temporarily hide the other categories.

