 Map with individual categories: representation of a typology
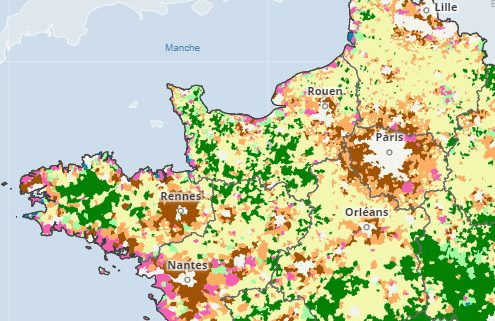
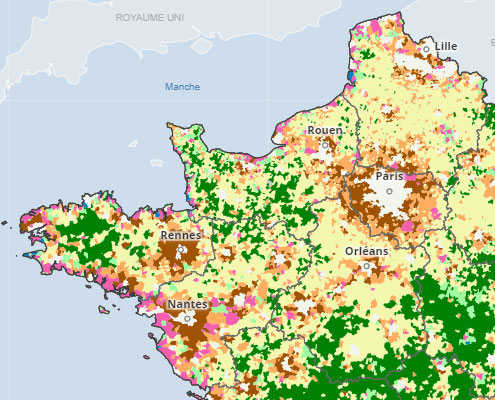
This kind of map is suitable for representing the distribution of geographical objects into different categories. Each geographical object is colored with a certain color according to its category. Like the maps with ranges of values, it is a choropleth map. The choice of colours is essential here, so that the different categories can be distinguished from each other, while remaining balanced.
The illustration shows the typology of rural areas by municipality. For example, the brown colour represents the dynamic countryside near cities. A tip: to isolate one of the categories, simply click on the square of its color in the map key to temporarily hide the other categories.

