CARTOGRAPHIC SEMIOLOGY
How to represent data on a map?
The way an indicator is represented on a map depends on the nature of the indicator. To choose the appropriate representation mode, Géoclip relies on cartographic semiology rules.
The one who first formalized these rules was Jacques Bertin, in his treatise Graphic Semiology. Diagrams, networks, maps, published in 1967 and which still remains the reference in this matter.
The advent of office computer technology and the Internet have made powerful information processing tools accessible to the greatest number of people. This should not lead to losing sight of the fundamentals set out more than 50 years ago.
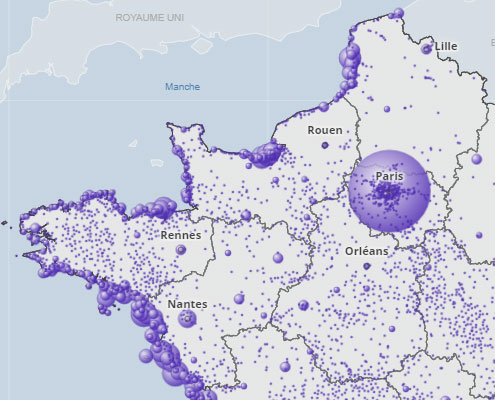
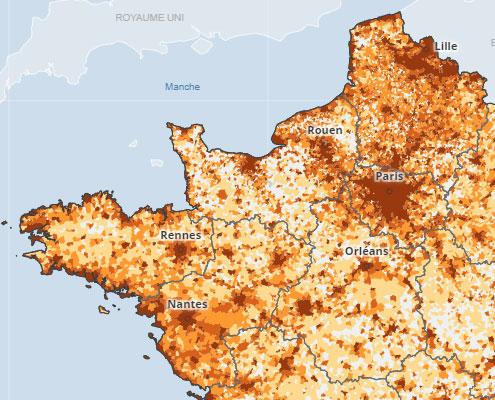
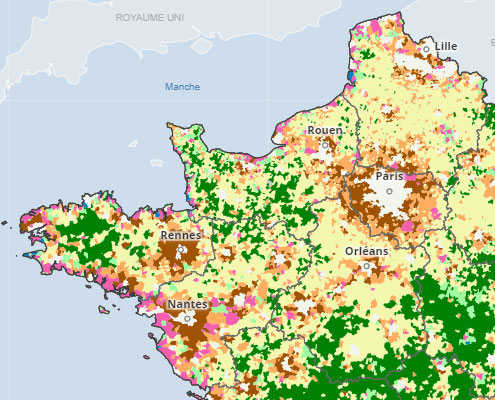
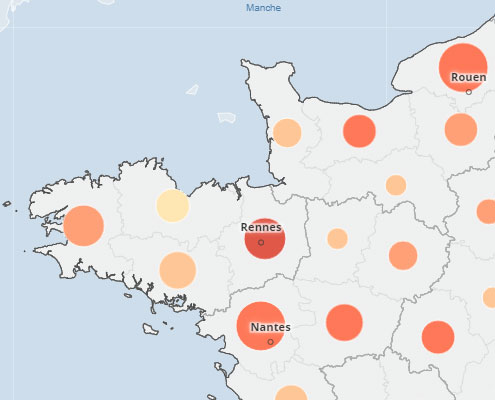
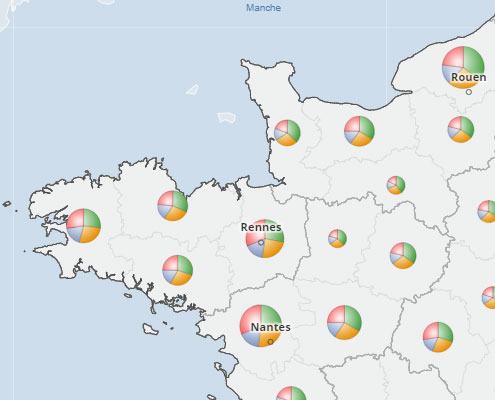
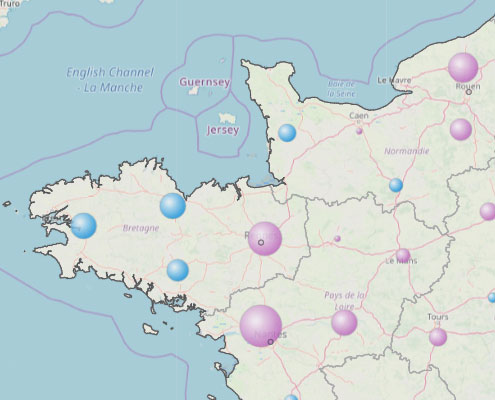
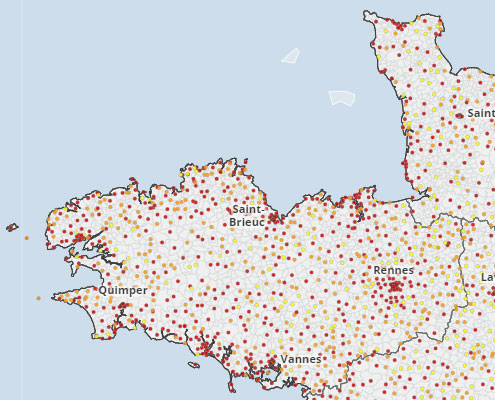
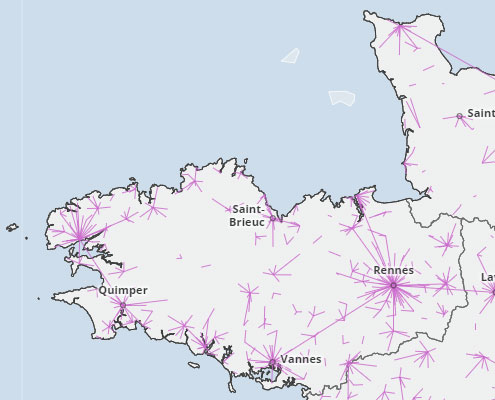
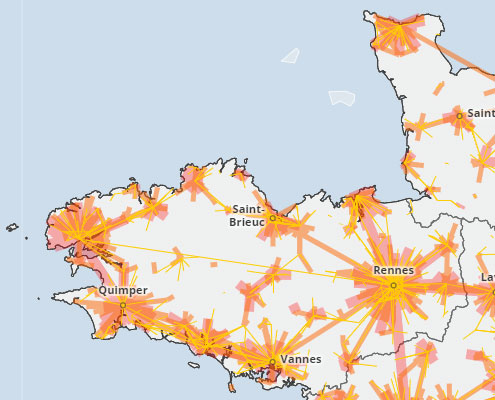
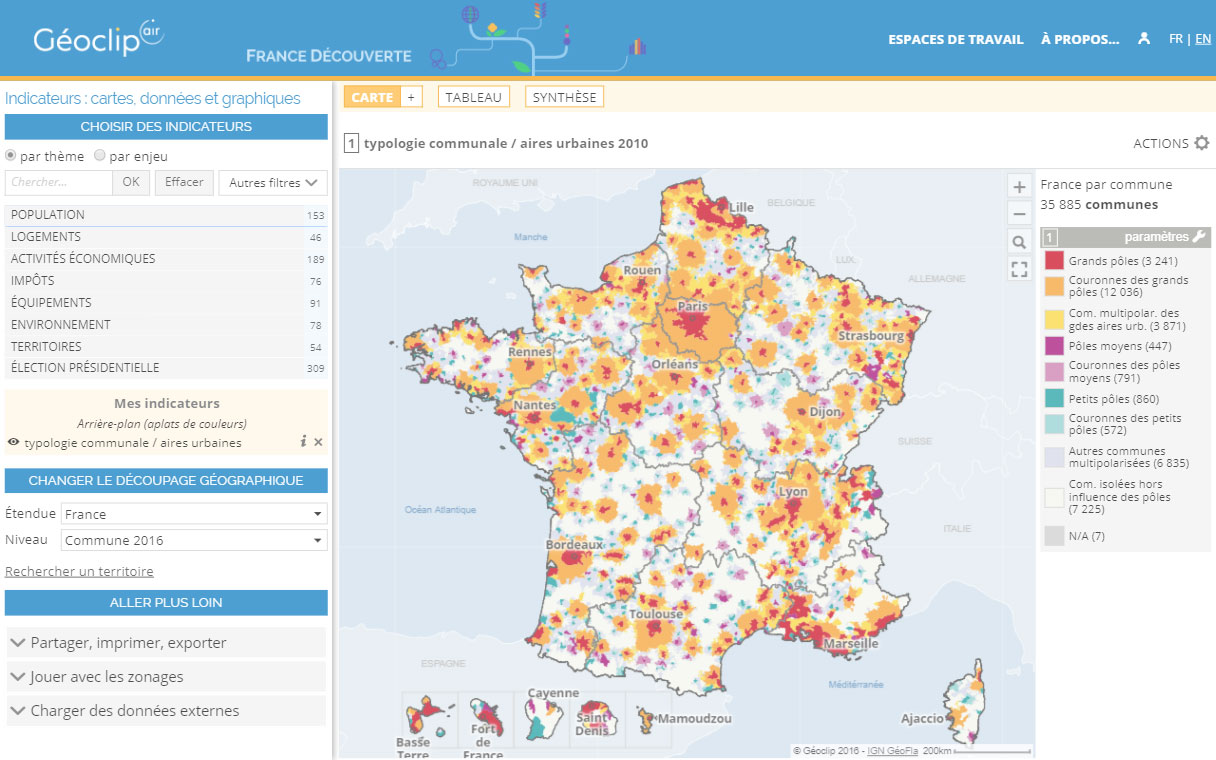
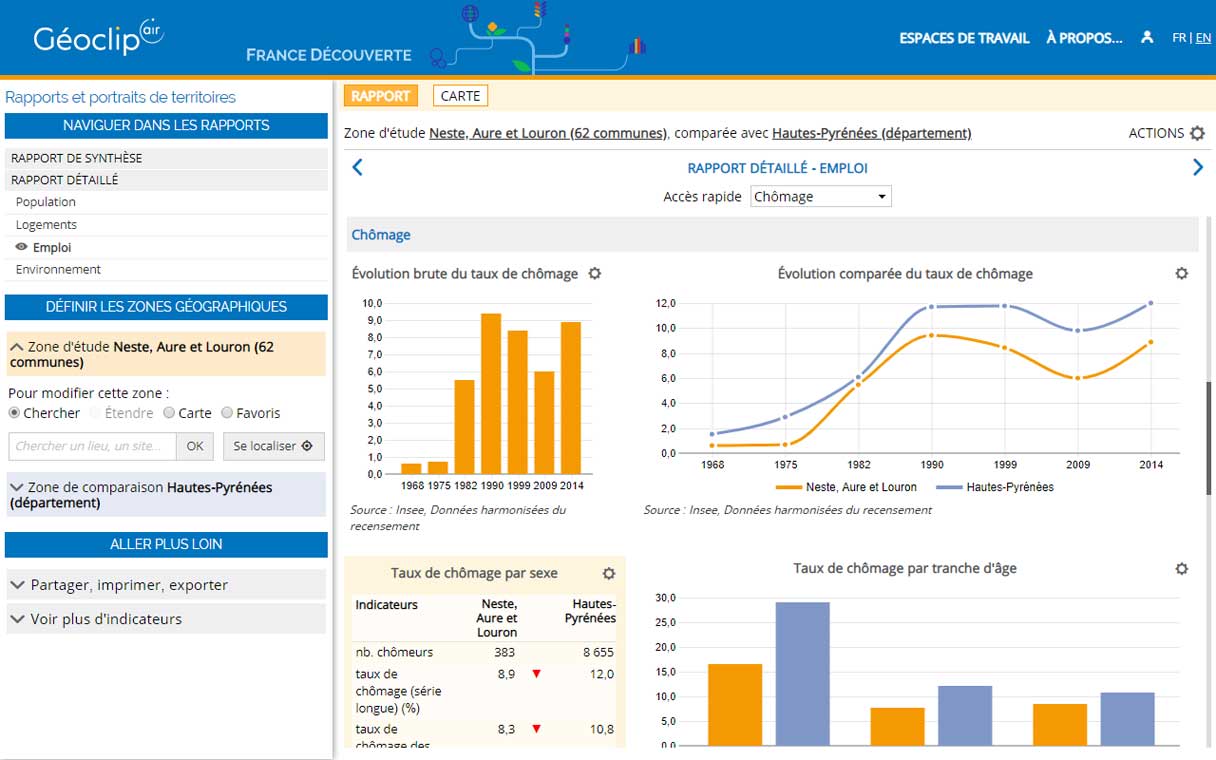
The images below illustrate the main representation modes used with Géoclip. By clicking on each of them, you will get more information on the semiology rules and principles used to build each map.