Application web légère et rapide

Interactive maps
& dashboards

Géoclip is a powerful and fast
data-visualization software
for your statistical and location data.
As a full web solution,
it is easy to deploy,
on Internet or intranet.

Géoclip multisupport

Adaptative, smooth,
educational

Géoclip adapt
to all media,
wherever you may be,
in a meeting or in the field.

Le contenu de Géoclip peut être exporté et réutilisé facilement.

Géoclip, your tool
for territorial
management

Analyse all levels of territories
and compare them.

idée

Dynamic maps and data-visualization,
online statistical software

video
play-sharp-fill

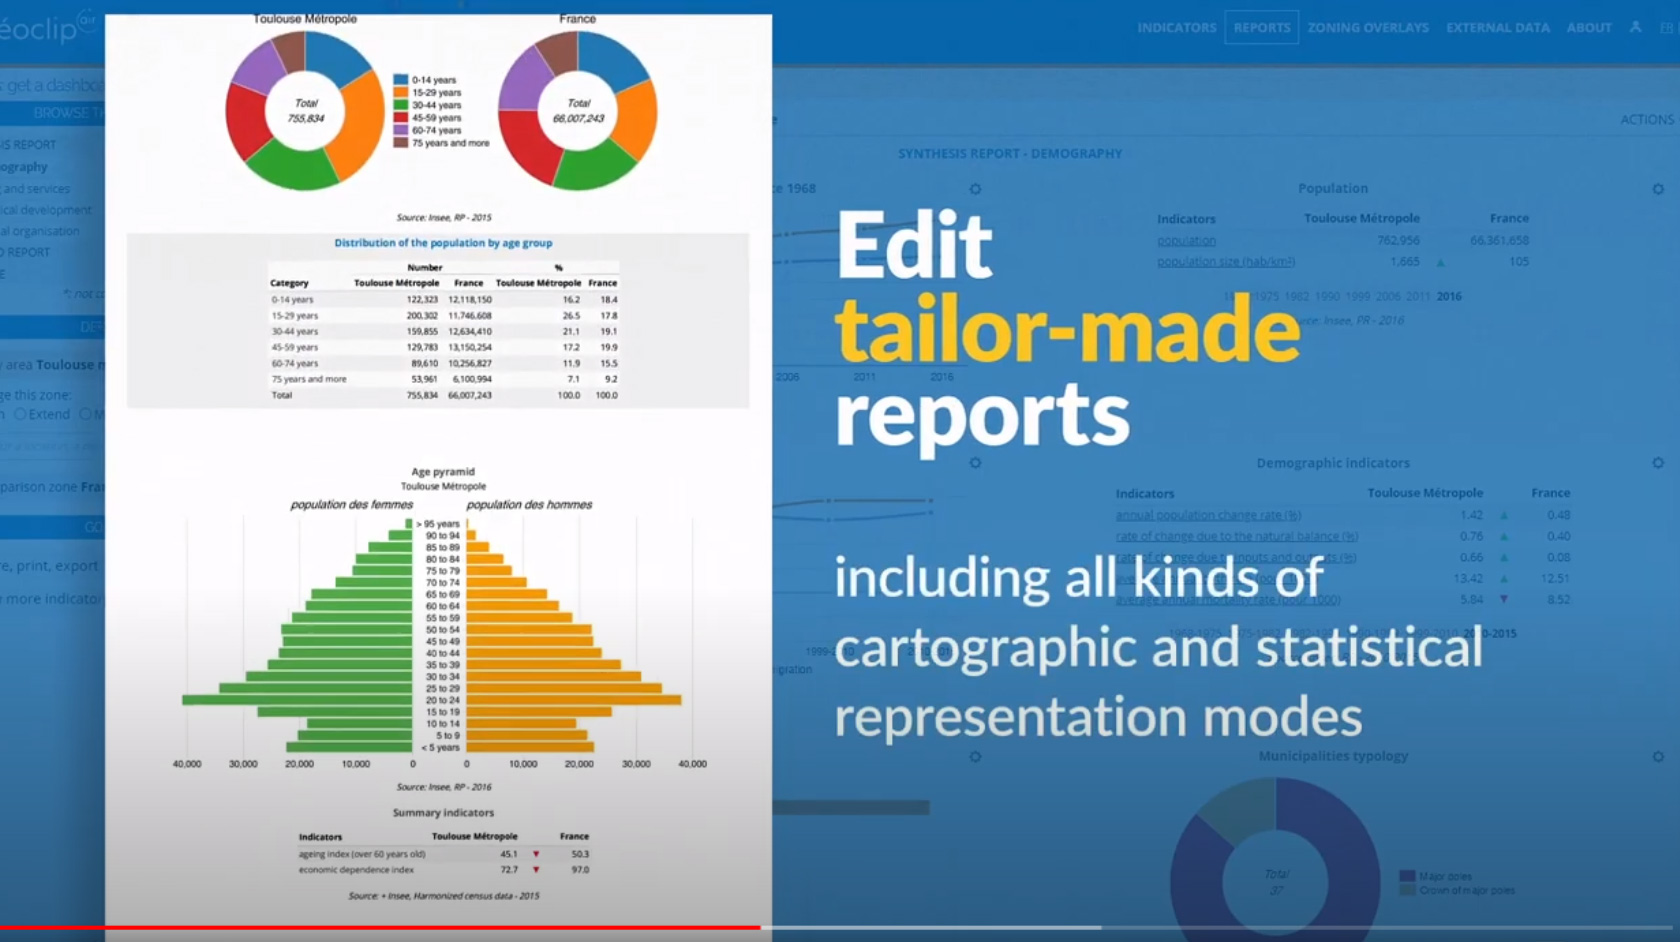
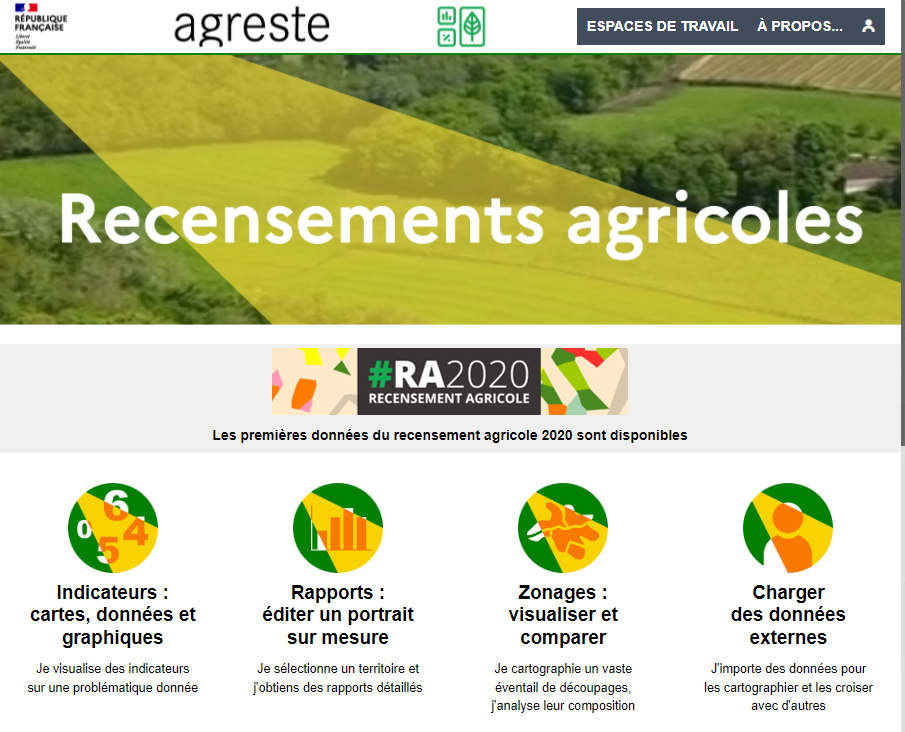
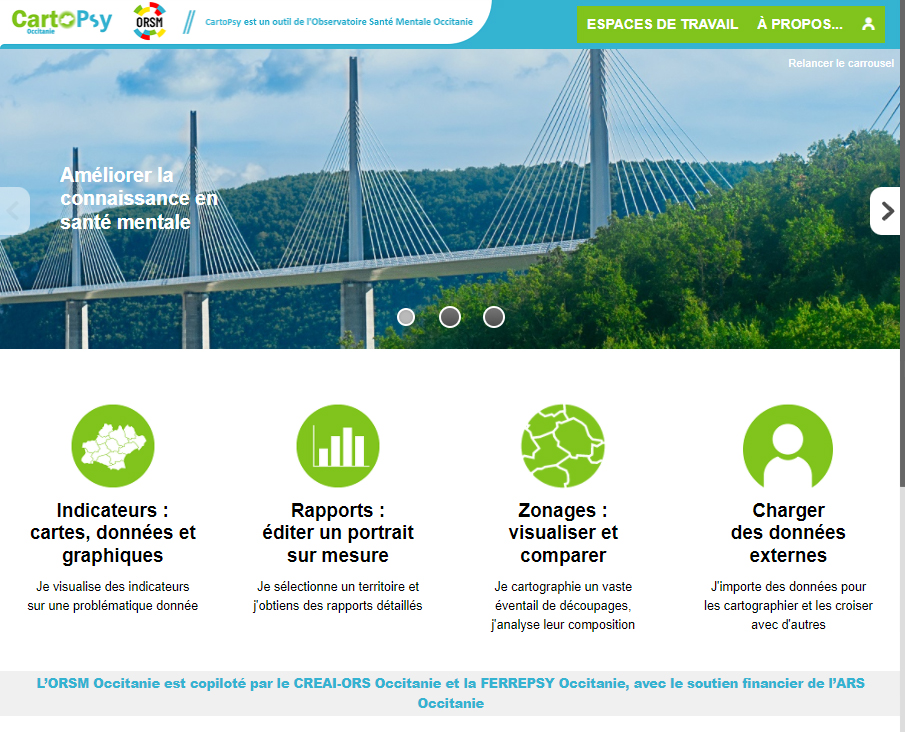
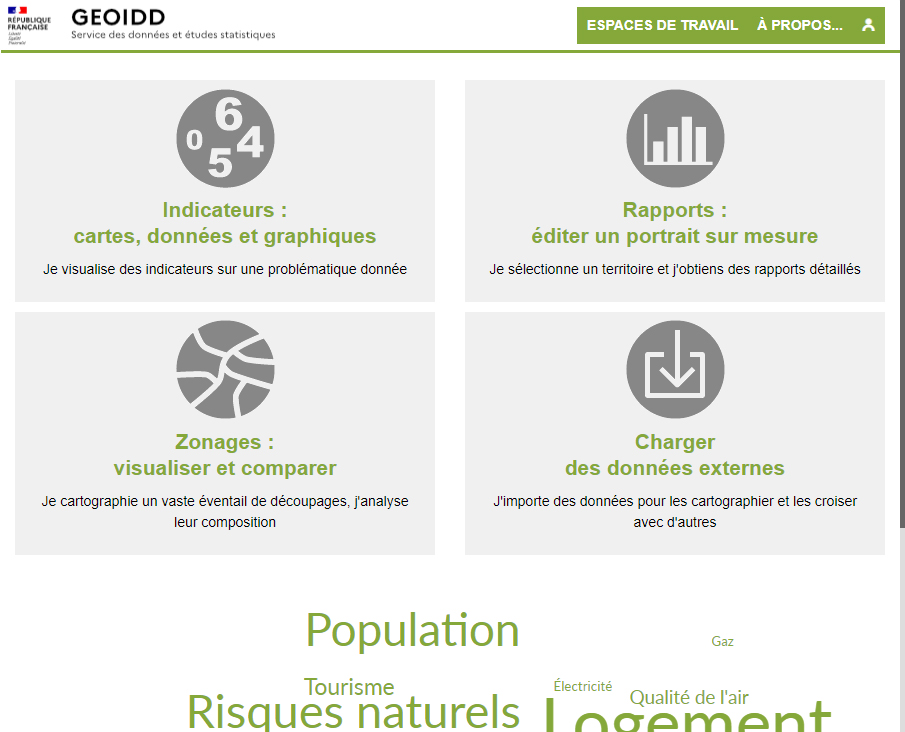
With Géoclip Air, put your location data on line, with visual maps and interactive dashboards

Truly interactive cartography, a wide range of intuitive, geographic navigation and selection tools, state-of-the-art thematic analyses, customized reports and portraits of territories.

Démonstrations

Demonstrations

One 'showcase' application managed by Emc3 which cover all the Géoclip features.

France Découverte is a full demonstration to test Géoclip, with all the features available to users. This observatory, open to all, now operates with a Géoclip Air engine, the latest generation of Géoclip.
The France Découverte user, whether a student, teacher, journalist, economic actor or simply a curious citizen, will enjoy exploring France from a statistical point of view, thanks to a fast, intuitive and fun interface!

This European observatory relies on Eurostat's geographic and statistical databases to disseminate local statistical data and geolocalized indicators on various themes on the 37 countries of the European zone.
This demonstration uses the Eurostat Nuts nomenclature, which includes four geographical levels - from Nuts0 to Nuts3; it also highlights a specific map layer showing population estimation per 1-kilometer tile.

actualités

Géoclip News

GEOCLIP USE CASE:
THE FRENCH “REGIONAL HEALTH AGENCIES” (ARS') C@RTOSANTÉ OBSERVATORY

The French “regional health agencies” (ARS) are responsible for the regional management of the health system in France. They are carrying out various information dissemination projects, including “C@rtoSanté”, one of their geostatistical observatory based on Géoclip.
Géoclip 4.12.0 is available

GÉOCLIP 4.12.0 IS AVAILABLE

Géoclip reveals its version 4.12.0 to provide the latest news to users and administrators on the TJS protocol as well as improvements related to security, administration, user interface, etc. of observatories.

GEOCLIP USE CASE:
Santé publique France's Géodes observatory to follow the Covid-19 coronavirus pandemic

Santé publique France is the national public health agency in France. Their vocation is to monitor, supervise, prevent, alert and take action on a wide range of public health topics in France. Informing the general public is one of their missions. To do so, Santé publique France relies on Géodes, their web geostatistical observatory based on Géoclip.
Géoclip - Télécoms - Fibre optique FTTH

DEMONSTRATION GEOCLIP :
Observatoire du déploiement de la fibre optique FTTH

Découvrez l’observatoire du déploiement de la fibre optique :  telecoms.geoclip.fr. Cette démonstration Géoclip a été créée par les équipes de Business Geografic en vue de proposer un observatoire géostatistique du déploiement de la fibre optique FTTH ("fiber to the home", fibre optique jusqu'à l'abonné) sur le territoire français.

Gathering and processing the results of the municipal elections:
a detective's job

In order for the results of the municipal elections to be available in the Observatoire des Votes en France on the morning after the elections, this requires a meticulous work of collection, preparation and integration beforehand. There are a few pitfalls to be avoided in order to thwart all the subtleties of a more complex vote than it seems.

ANCT's Territorial Observatory has been given a new look, and uses the new Géoclip APIs

The Observatory of Territories now presents itself with a renovated ergonomics, which highlights the many practical services offered. This major development makes even greater use of the intelligence provided by Géoclip via new APIs.
GeoIgnite 2020

GeoIgnite - July 2020

Ciril GROUP takes part for the second consecutive year in GeoIgnite, Canada's national GIS event; a virtual edition this year due to the current context.   In view of the global health crisis related to the Covid-19 coronavirus pandemic, GeoIgnite's team has modified the format of the event to ensure that it takes place in the best possible…

Learning how to navigate in the Digital Atlas of Belgium

Here is a video that shows in a few minutes how to use the main functions of the Digital Atlas of Belgium. This video explores the indicators workspace. In particular, it is based on an example of agricultural data mapped by a combined representation in coloured circles: the circles correspond to the agricultural surfaces and their colours to the proportion in the total agricultural surface.
Estimation carroyée de population

Maps of grided population estimate in Europe

The Géoclip « Europe découverte » observatory uses statistical and geographical data published by Eurostat, the European Union's statistical office. It also features population estimate data per 1 km grid, which gives a very detailed picture of population distribution.

tarifs

Our prices

Licence for Géoclip Server
17 000 €
For a given domain name. Purchasing of this licence entitles customers to build as many observatories for as many users as they wich.
Annual maintenance fee
3 000 €
The service includes corrective maintenance, upgrades and technical support. Corrective maintenance and upgrades are granted free for the first year.
On request
Options
According to each customer's requirements: Support services, Tailor-made developments.