 Combined representation of an indicator as relative values and an indicator as absolute values
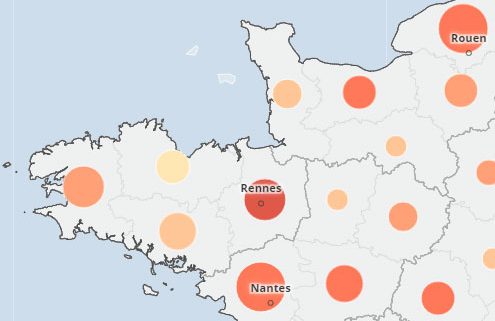
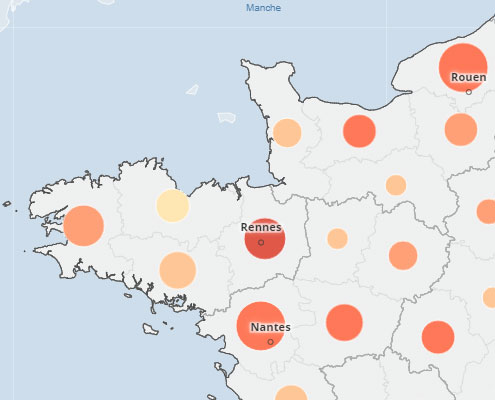
Two representations can be overlaid: symbol representations and colored areas. The representation proposed here goes a little further: it combines the representation of an additive quantity by proportional circles with that of a relative quantity by ranges of values. It superimposes these two representations, using the circles of one as supports for the colored areas of the other.
The illustration shows the part of the municipal population aged 15 to 29 years in each department. It shows that the proportion of young people is high in the department of Ille-et-Vilaine (dark colour of the circle), whereas the population of this department is lower than that of Loire-Atlantique (surface of the circle).

