 Flow map: representation of a quantified two-location indicator
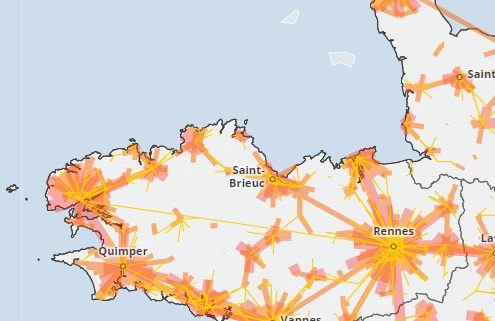
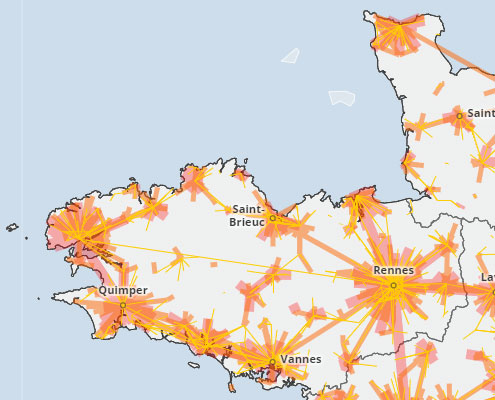
Like hedgehogs representations, flow maps represent bilocalised data, presenting the relationships between geographical units. If hedgehogs show the simple existence of relationships, the flows also show the intensity of the relationship, represented by the thickness (and colour) of the line connecting the geographical units.
The illustration shows the home-to-work shuttles, i.e. the travel flows of people living in one municipality and working in another. The arrows are oriented according to the direction of travel. Depending on the zoom level, the orientation may be displayed or not.

