 Proportional symbol map: representation of additive quantitative data
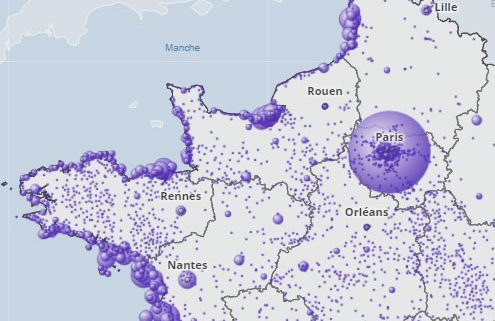
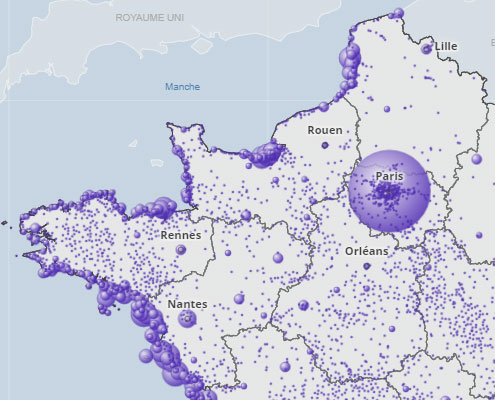
This representation mode is suitable for absolute, i. e. sumable, quantitative values. On this type of map, the value of an indicator is represented by a circle (or possibly another simple geometric shape) whose area is proportional to the represented value. This indicator must necessarily be a additive value, therefore, it can easily be summarized, by simple addition, for the higher geographical levels. Géoclip will automatically take this into account in summary sheets and reports.
The settings panel, accessible from the map key, allows you to change the color, transparency, shape and size of the circles. The illustration shows the number of second homes and occasional accommodations per municipality. This type of housing is particularly important in coastal communities and in Paris.

