Posts

GEOCLIP USE CASE:
THE FRENCH “REGIONAL HEALTH AGENCIES” (ARS’) C@RTOSANTÉ OBSERVATORY


⟫ Download the Géoclip case study - The French “regional health agencies” (PDF)


The French “regional health agencies” (ARS) are responsible for the regional management of the health system in France. They define and implement health policy in the French regions as closely as possible to the needs of the population. The French regional health agencies are carrying out various information dissemination projects, including “C@rtoSanté”, through their geographic portal “AtlaSanté”; these projects aim to support health professionals, territorial decision-makers, researchers, etc. in their decisions in the field of public health.

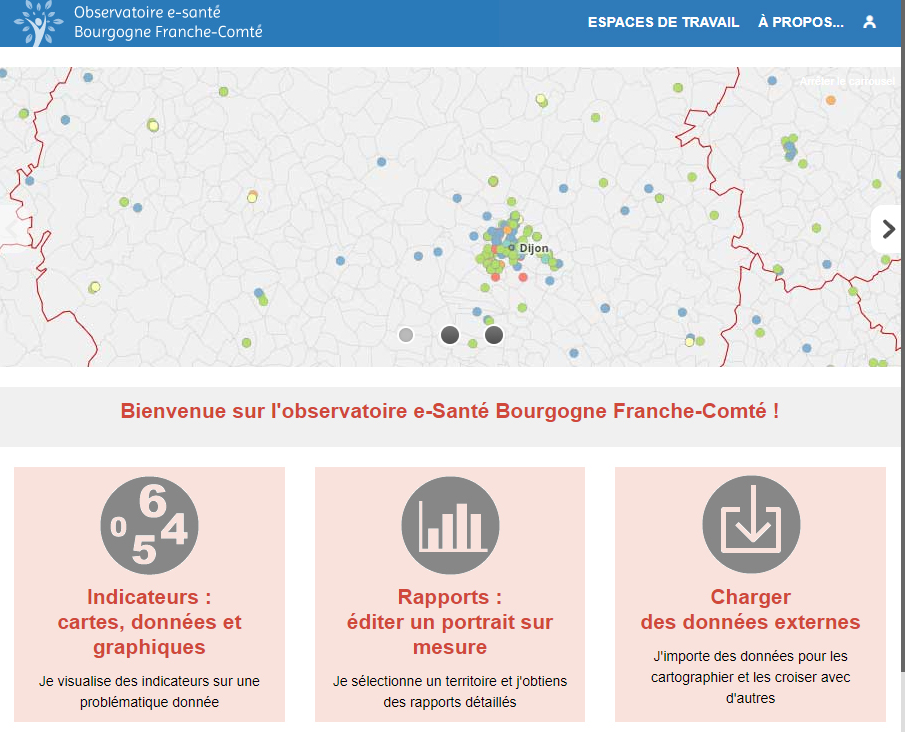
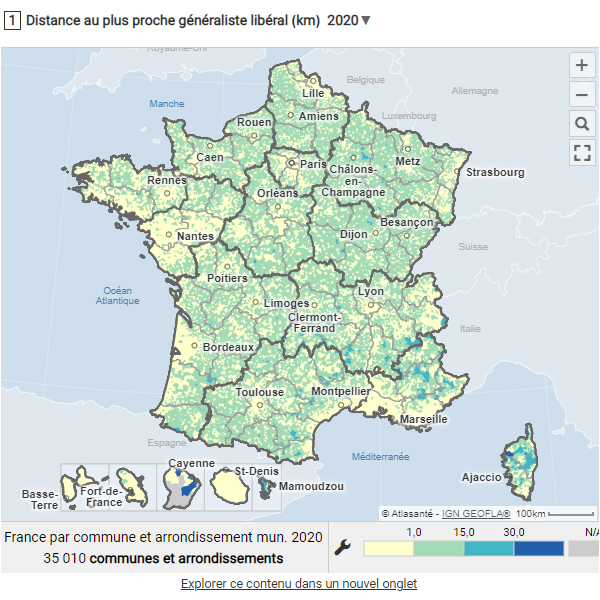
The geostatistical observatory “C@rtoSanté”, based on Géoclip since 2004, is one of the historical ARS projects dedicated to medical demography, demand and access to care for private primary care health professionals - general practitioners, nurses, massage therapists, physiotherapists, dental surgeons, speech therapists and midwives.


Read more

Ciril GROUP’s business continuity planning

Like everyone else, people working for Géoclip are adapting to the context imposed by the Covid-19 pandemic. Our hope is that everyone will find the resources to get through this exceptional situation in the best possible conditions. Within our teams, we are making every effort to ensure that our activities continue. Naturally, we have all adopted teleworking. Modern communication techniques fortunately allow us to continue our activities remotely.

The challenge for our teams is first and foremost to help curb the pandemic. This is why significant resources are being deployed so that we can continue to work together. Secondly, it is to preserve economic activity. We are therefore committed to remaining present and active.

For example, it is a great satisfaction for us to see that the Geodes observatory, of Santé Publique France, has been publishing daily and weekly data on the evolution of the epidemic for the past few days. We are proud to contribute, at our level, to the dissemination of reliable information. We are convinced that promoting knowledge is a good way to limit the insecurity that the health crisis we are inevitably experiencing generates.

Read more

explore dimensions indicators

Explore measles and influenza in all their dimensions

courbe évolution grippeLe cœur de Géoclip, c'est l'exploration de la dimension géographique des indicateurs : mettre les chiffres en cartes, pour les faire parler. Selon la nature de l'indicateur, le mode de représentation cartographique adapté sera déterminé : symboles proportionnels pour les grandeurs additives, tranches et dégradés de couleurs pour les valeurs relatives, pour les deux modes de base. Cela permet de visualiser comment une donnée statistique se répartit dans l'espace et comment des relations spatiales peuvent apparaître.

Read more

Portfolio Items