

Observatoires en ligne,
cartographie interactive
et rapports dynamiques
Géoclip Air,
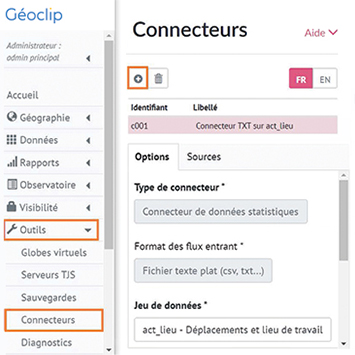
le créateur d’observatoires géostatistiques
pour cartographier les données locales
et dresser des portraits de territoires
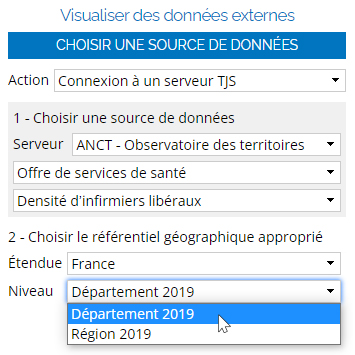
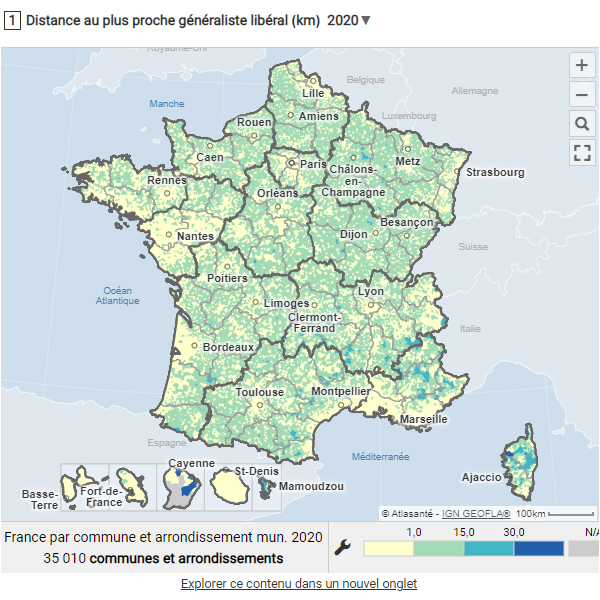
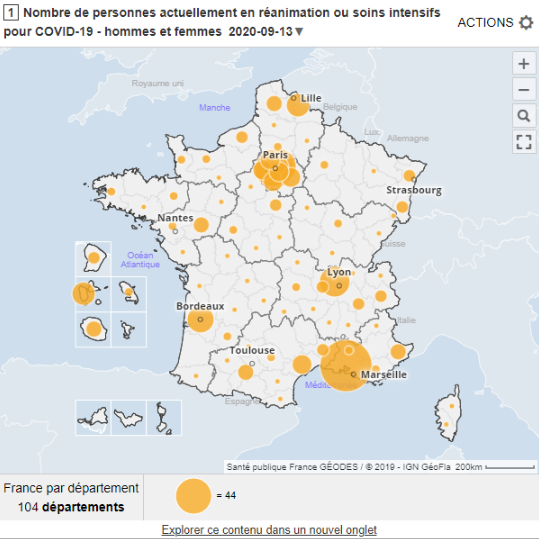
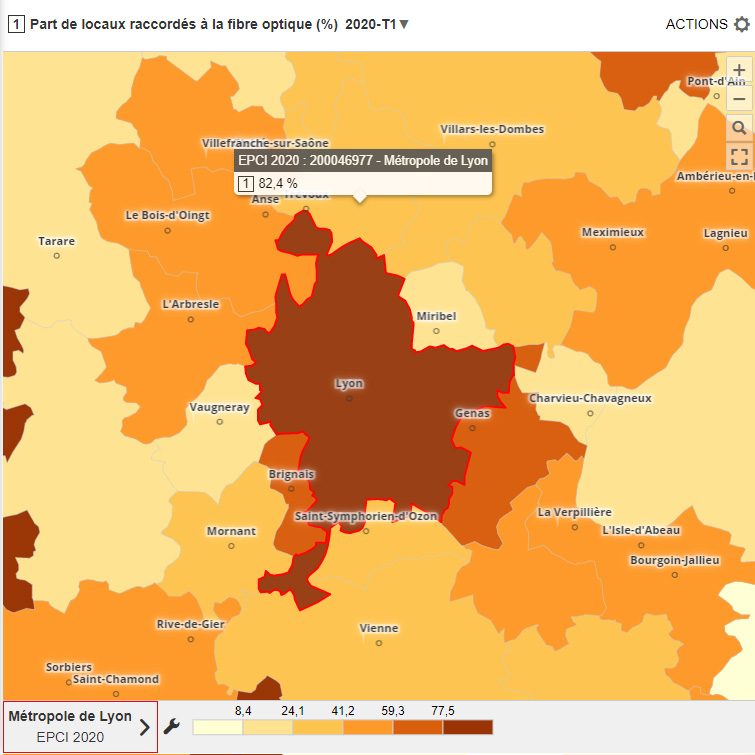
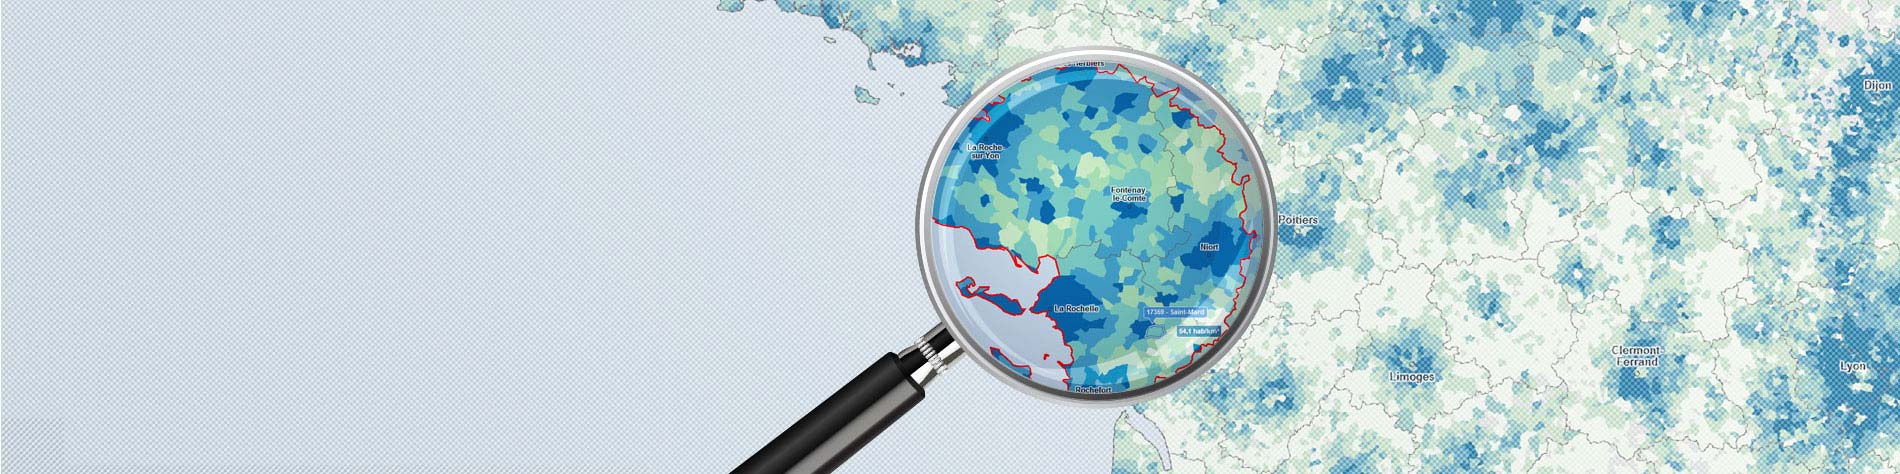
Une cartographie thématique et statistique web interactive,
des outils de navigation et de sélection spatiale intuitifs,
des analyses statistiques construites dans les règles de l'art,
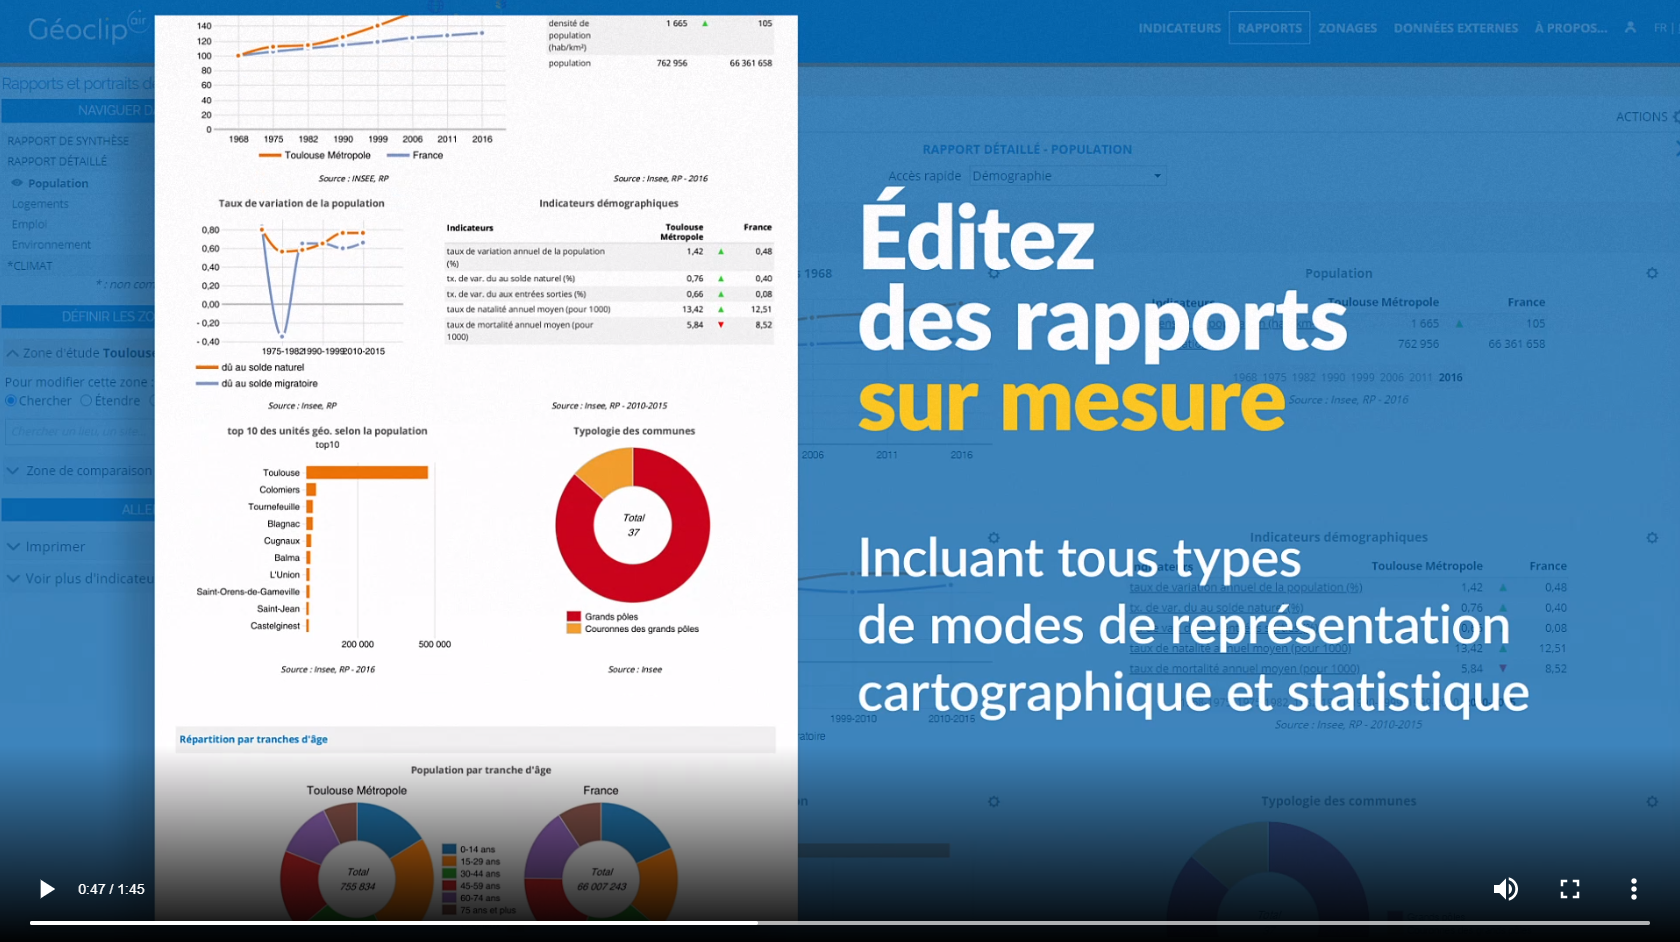
des tableaux de bord et portraits de territoires sur mesure.